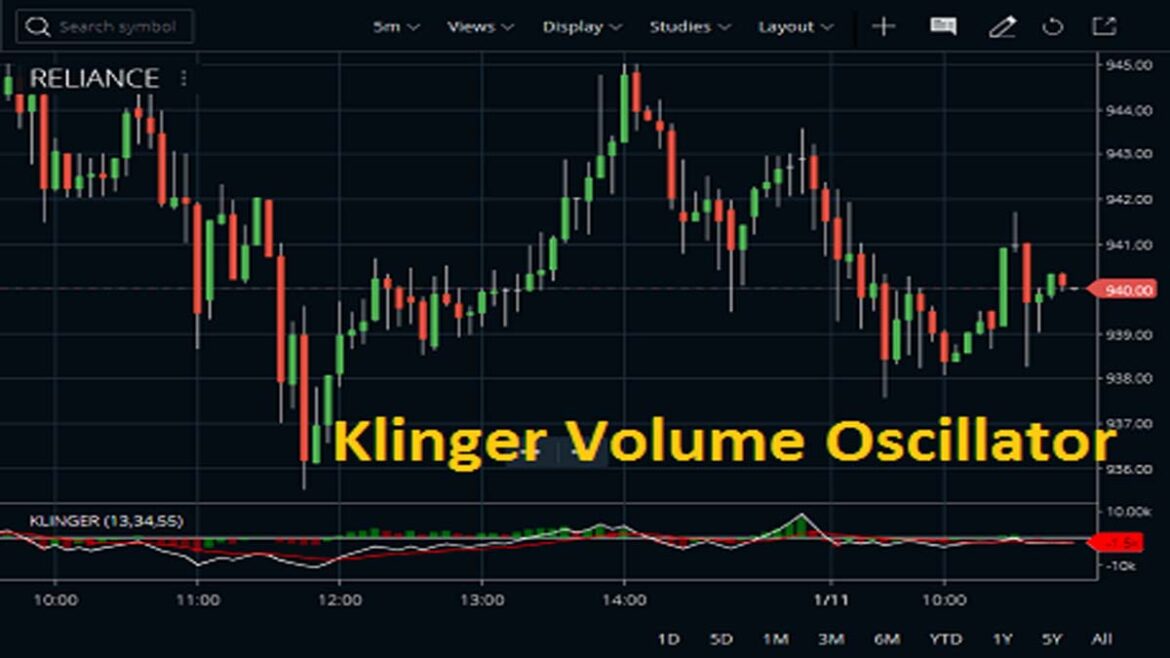
Klinger Oscillator
The Klinger Oscillator is a technical indicator used in stock market analysis. It was developed by Stephen J. Klinger and is based on the idea of using volume to anticipate changes in price trends. The oscillator combines both momentum and trend-following characteristics with the ability to generate buy or sell signals when certain levels are reached.
The formula for calculating the Klinger Oscillator takes into account two moving averages, one of which is shifted forward 26 days:
K = EMA(Volume,9) – EMA(Volume,26).
A 9-day exponential moving average (EMA) of volume is subtracted from a 26-day EMA of volume to form the indicator. When this value crosses zero it generates either a buy signal or sell signal depending upon whether it has crossed from above zero or below zero respectively. Generally speaking, if the indication moves above +50 then there could be strong upward pressure on prices while conversely, if it dips below -50 then there could be strong downward pressure on prices.
In conclusion, although not as widely used as other technical indicators such as Moving Averages or RSI’s etc., The Klinger Oscillator can still provide traders and investors with valuable insight into potential price movements making it an important tool in any trader’s arsenal!


