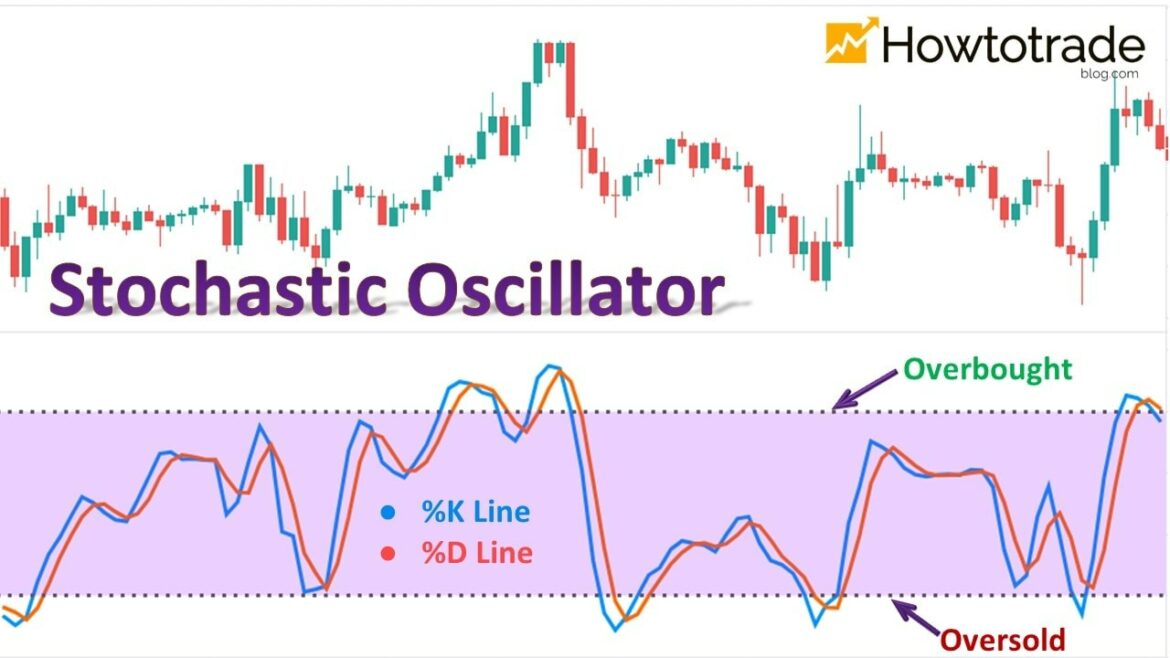
#Stochastic Oscillator
The Stochastic Oscillator is a technical analysis indicator that compares the closing price of an asset to its price range over a given period of time. It indicates whether or not current market conditions are overbought or oversold and can be used as part of a crypto trading strategy. The oscillator ranges between 0 and 100, with readings below 20 indicating an oversold condition and readings above 80 indicating an overbought condition.
The stochastic oscillator was developed by George C. Lane in the 1950s and is one of the most widely used indicators in cryptocurrency trading today. It uses two lines, %K (the main line) and %D (a signal line). The %K line tracks changes in the closing price from day-to-day while %D shows how quickly those changes occur relative to past prices. If the %K line moves upward rapidly, it suggests increasing buying pressure which could indicate that prices may soon rally; similarly if it drops rapidly then selling pressure might push prices lower. Traders often use crossovers between these two lines as signals for buy/sell decisions – when both lines move downwards together this usually indicates bearish sentiment whereas when they rise together it could suggest bullishness ahead.
While there are many different ways to interpret the Stochastic Oscillator, traders should pay attention to any potential divergences with other indicators such as moving averages or MACD before making any major trades based on its reading alone – divergence can help confirm significant uptrends or downtrends within cryptocurrencies markets prior to major developments taking place across them overall.


