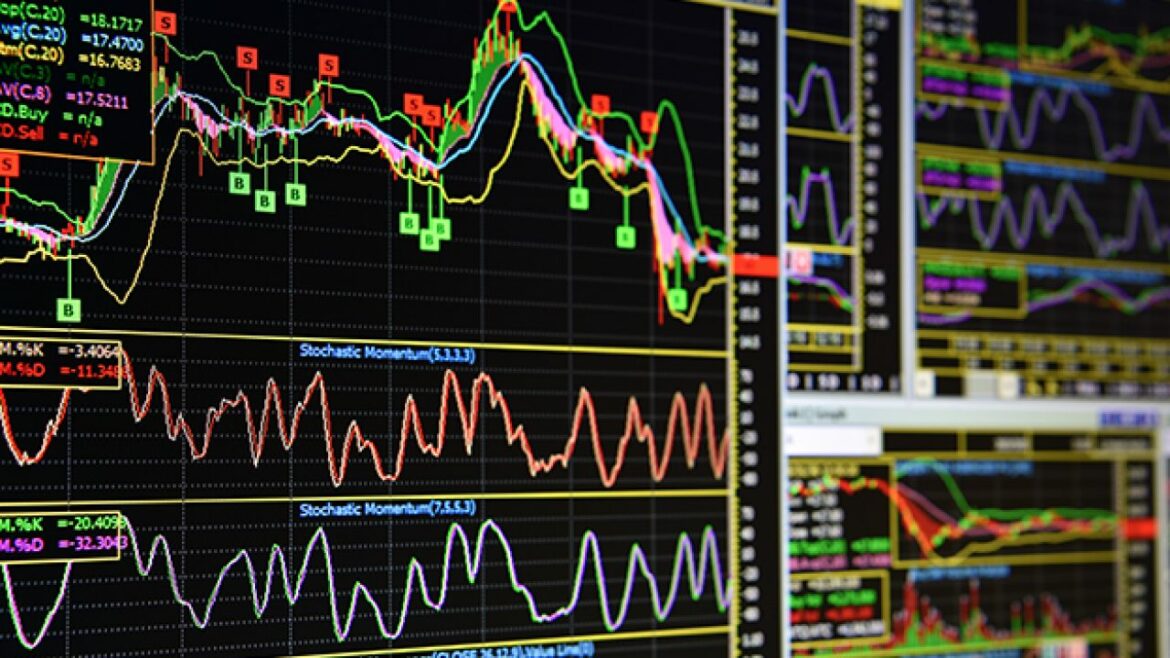
Technical Indicators are a type of analysis used by traders to help them make decisions on when to buy, sell and trade cryptocurrency. They are based on past price movements and can provide an indication of the future direction of prices.
There are three main types of technical indicators: trend, momentum, and volatility. Each one is designed to measure different aspects of market activity and provide signals for trading decisions.
Trend indicators measure the overall direction in which the market is moving over time. Examples include moving averages, trend lines, and support/resistance levels. These indicators give an indication as to whether there is a strong uptrend or downtrend in place, so that traders know when it may be best to enter into long positions (buy) or short positions (sell).
Momentum indicators identify potential changes in momentum before they occur by measuring how fast prices have moved recently compared with earlier movements in the same period. For example, relative strength index (RSI) measures recent gains against losses within a given range while stochastics compare closing prices over different periods such as 14-day highs or lows with current prices. Momentum indicators can help indicate if a coin is becoming overbought or oversold so that traders know when it may be best to take profits or exit their position before further loss occurs.
Volatility Indicators measure how much movement there has been on average during certain periods such as five days or one month – providing insight into whether markets have been more volatile than usual lately due to news events or large trades happening at exchanges etc., This helps indicate whether now might be good times for entering into new trades based on expected higher returns from increased volatility but also alerting traders about possible riskier conditions ahead where larger losses could occur if not carefully managed through stop-loss orders etc.. Some common examples include Bollinger bands and Average True Range (ATR).
In conclusion then Technical Indicators can prove invaluable tools for crypto-traders who wish to gain insights into market trends & behaviour thus enabling them better assess opportunities available while managing associated risks more effectively too!


