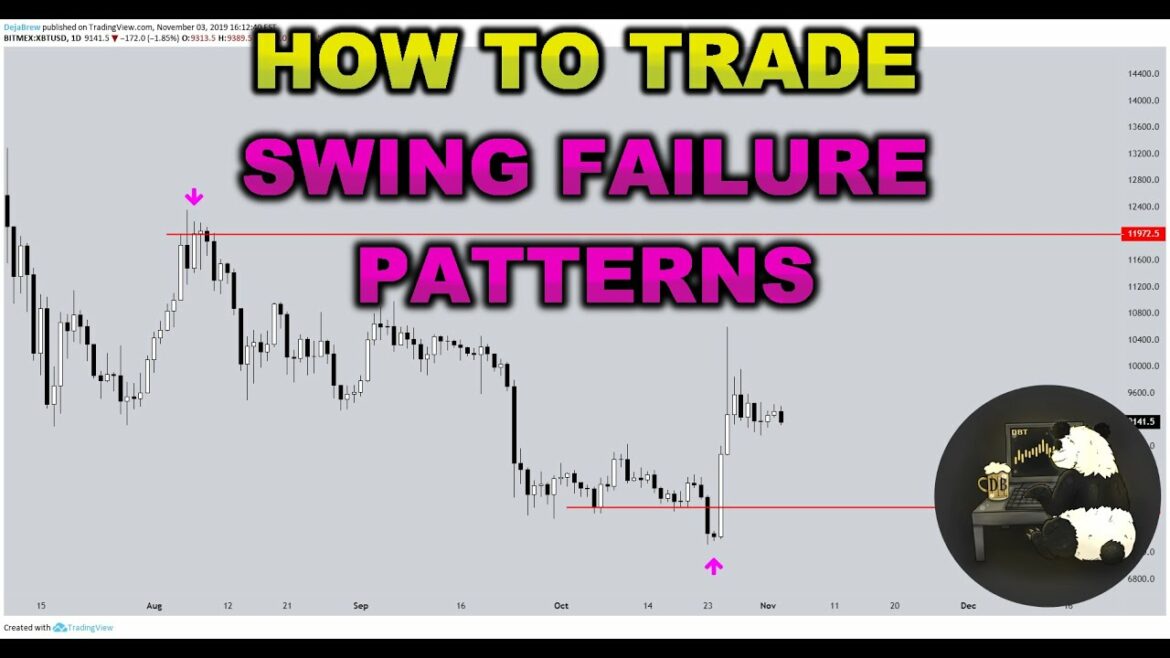
Swing Failure Pattern (SFP)
The Swing Failure Pattern (SFP) is a technical analysis tool used for predicting market reversals in price trends. It was developed by Thomas N. Bulkowski, an American author and expert on chart patterns who wrote the book Encyclopedia of Chart Patterns. The SFP pattern is recognized as one of the most reliable reversal indicators based on its accuracy and reliability to signal imminent trend changes.
Definition
The Swing Failure Pattern occurs when a prior uptrend fails to generate new highs or resistance levels, then breaks through existing support lines before falling again below the previous high or resistance level that was broken previously. This forms a double top pattern wherein prices drop sharply after reaching two consecutive highs and then break lower than their original support line which signals impending bearish momentum in the near future and eventually results in a trend reversal from bullish to bearish sentiment.
Identifying an SFP
To identify an SFP, traders look for two peaks at approximately similar price points that are not connected by significant higher highs; this indicates that buyers have been unable to sustain their interest at those particular price levels leading to lower lows between them instead of higher ones like what would happen during a regular uptrending period. Once identified, traders will watch closely how prices react after breaking below the low point reached between these two peaks – if prices continue dropping without bouncing back up significantly beyond where they initially broke down from then it’s likely we’re dealing with an SFP setup here as it suggests waning buyer demand leading towards eventual bearish market conditions ahead of time before anyone else notices it coming.
Conclusion
In conclusion, the Swing Failure Pattern is one of many powerful tools used for trading strategies involving reversing trends due to its excellent performance record when utilized correctly within markets exhibiting actual trending behavior rather than sideways volatility; however caution should still be taken into account when using such indicators as there are no guarantees involved with any kind of technical analysis nor can they indicate precise turning points accurately all times due simply because markets don’t always behave according to expectations regardless how advanced our predictive models become over time so make sure you practice proper risk management techniques whenever possible!


