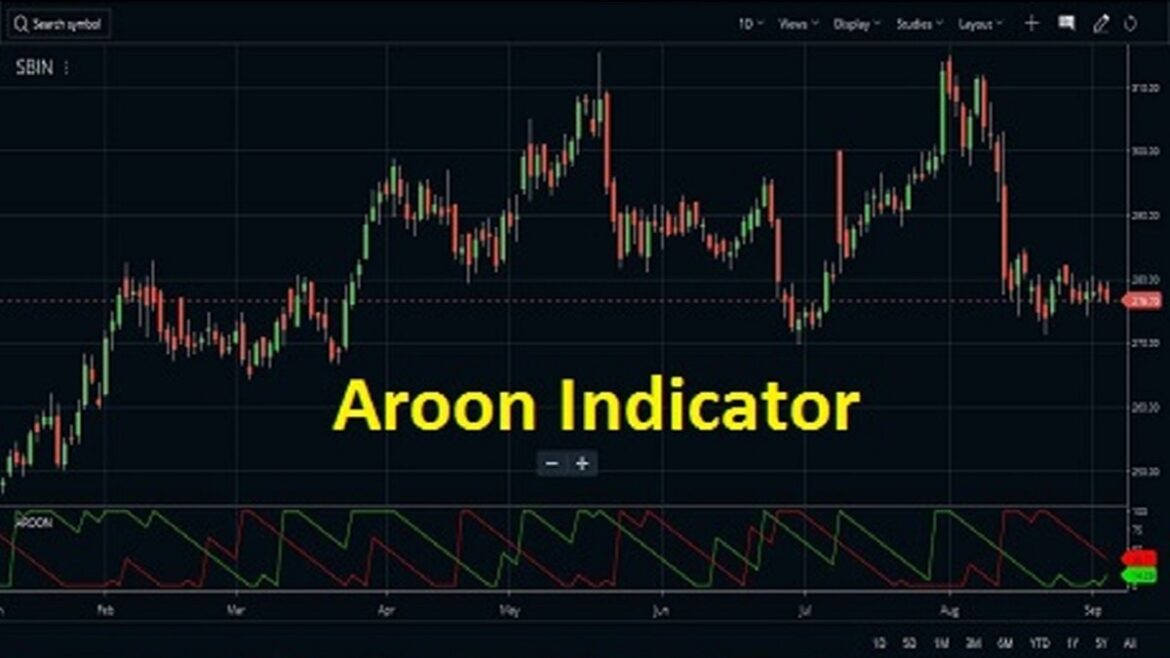
What is an Aroon Indicator?
An Aroon indicator is a technical analysis tool developed by Tushar Chande in 1995 to measure the strength of a trend. It consists of two lines, one for up trends (Aroon Up) and one for down trends (Aroon Down), that are plotted on a graph from 0 to 100. The Aroon Up line measures how much time has passed since price made its most recent high, while the Aroon Down line measures how much time has passed since price made its most recent low. When both lines are near 100, it indicates strong momentum in the market; when they’re close to 0, it suggests there isn’t any momentum at all.
How Does the Aroon Indicator Work?
The calculation behind the Aroon indicator is relatively simple: it subtracts the current closing price from previous highs and lows over a given period of time to generate an oscillating value between -100 and +100. If prices have been making higher highs or lower lows over that period of time, then you will see positive values from +50 upwards; if prices have been decreasing or flatlining over that same period then you will see negative values going down towards -50.
When examining an asset with this tool traders should look out for areas where both lines show strong readings at around 100. This usually means there’s good directionality in either bullish or bearish sentiment which could be used as signals for entering trades or exiting positions depending on whether traders want to buy into rising markets (bullish sentiment) or take profits during falling markets (bearish sentiment).
What Are Some Common Uses For The Aroon Indicator?
The main use of the Aron indicator is detecting changes in momentum within a given market so traders can act accordingly when they see signs of reversal coming up such as early breakouts/breakdowns before other indicators catch them too late – this way they can enter/exit their positions earlier than others and increase their probability of success. Additionally, some traders also use this as part of their overall strategy by combining with other tools like moving averages and MACD histograms which can create more reliable buy/sell signals when taken together rather than just relying solely on one single indicator alone!


